Bear Markets Don’t Reveal Weak Tokens. They Reveal Weak Market Structure
Why bear markets expose fragile liquidity and broken market structure in crypto.

Bear Markets Are Stress Tests, Not Sentiment Shifts
Bull markets are forgiving. Flow is abundant, volatility is directional, and risk is easily intermediated. In that environment, market structure rarely gets tested. Prices move because buyers overwhelm sellers, not because liquidity is robust.
Bear markets invert this dynamic. Flow becomes asymmetric, volatility spikes without directional conviction, and inventory risk dominates quoting behaviour. Under these conditions, price discovery no longer depends on enthusiasm but on whether the market can intermediate risk at all.
When prices gap, spreads explode, or liquidity vanishes in a bear market, the failure is often misdiagnosed. The problem is not that demand disappeared. It is that market structure stopped functioning under stress.
What Weak Market Structure Actually Means
Weak market structure is not a vague concept. It is observable, measurable, and repeatable across tokens and market regimes. In diagnostics, it typically manifests along three dimensions.
Order Book Fragility
Order book fragility rarely appears at the top of book. In many tokens, quoted spreads remain tight and execution appears smooth, even as executable liquidity deteriorates rapidly beyond minimal price moves. The structural weakness lies not in the first price level, but in how execution costs evolve as orders move away from the mid price and across market regimes.
Under stress, this fragility becomes explicit. Execution costs become unstable and asymmetric as liquidity providers reduce quote size or withdraw depth in response to rising volatility and inventory risk. These adjustments do not occur gradually. They appear as episodic contractions in executable depth, where the notional required to move price by a fixed threshold declines sharply, increasing price sensitivity to flow. Liquidity does not disappear continuously; it withdraws when risk budgets bind.
The same dynamics also explain why liquidity often looks deceptively robust in flow-driven regimes. During periods of persistent directional flow, execution feels efficient, spreads compress, and markets appear deep. This apparent liquidity is frequently a by-product of aligned order flow rather than resilient structure. Execution costs beyond the top of book remain unstable, even when activity is high, revealing shallow depth beneath the surface. Liquidity appears abundant as long as trades move with momentum, but thins rapidly once that flow weakens or reverses.
Taken together, these patterns highlight a critical distinction. Liquidity supported by persistent flow is not the same as liquidity engineered for resilience. Fragile order books can appear functional in benign conditions while failing abruptly when markets are forced to absorb risk in both directions. The illusion disappears precisely when liquidity is most needed.
Methodological Note
Charts in this article are derived from anonymised token liquidity diagnostics conducted across multiple venues and market regimes. Visuals have been standardised for clarity and do not reference specific tokens.
Cost to Move Price by ±2% Over Time

Liquidity Concentration Risk
Liquidity concentration is one of the most common and least examined structural vulnerabilities in token markets. Even when a token is listed across multiple venues, executable depth is often heavily concentrated on a single exchange.
In benign conditions, this dependency goes largely unnoticed. Under stress, it becomes a single point of failure. When the dominant venue de-risks or experiences directional flow, secondary venues are rarely able to absorb meaningful volume. Apparent multi-venue liquidity masks a structurally fragile market.
Downside depth is often greater than upside depth — a normal feature of crypto markets driven by inventory management and flow asymmetry. The structural risk lies not in the imbalance itself, but in the concentration of that depth and the speed at which it deteriorates when conditions change.
Fragmentation without coordination amplifies this effect. Multiple listings do not guarantee resilience if liquidity is not distributed.
Market Depth Analysis
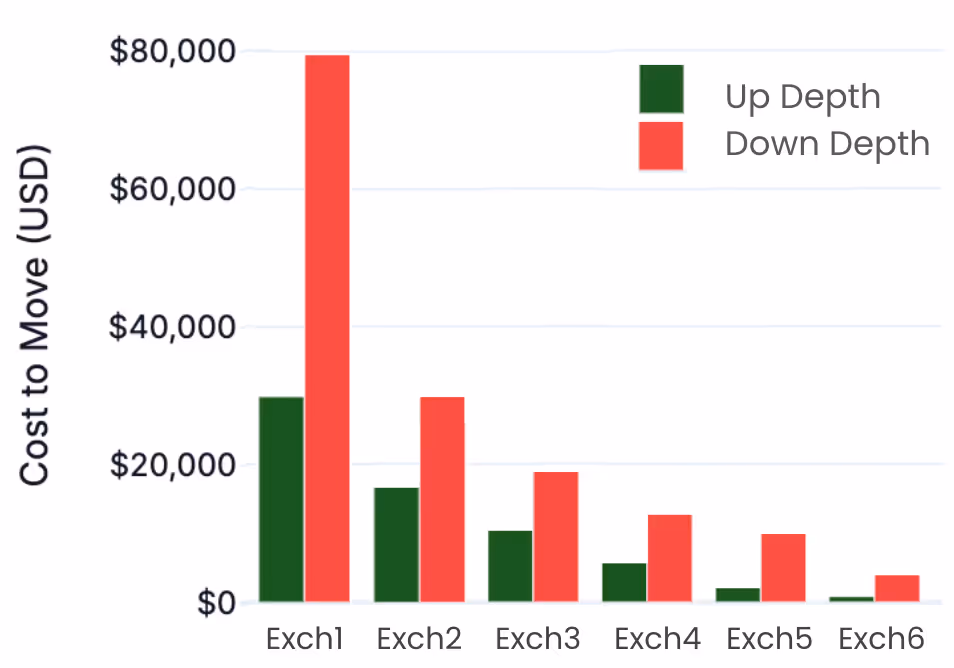
This is where “we’re listed everywhere” stops being a meaningful statement.
Structural Weakness and Risk-Constrained Liquidity
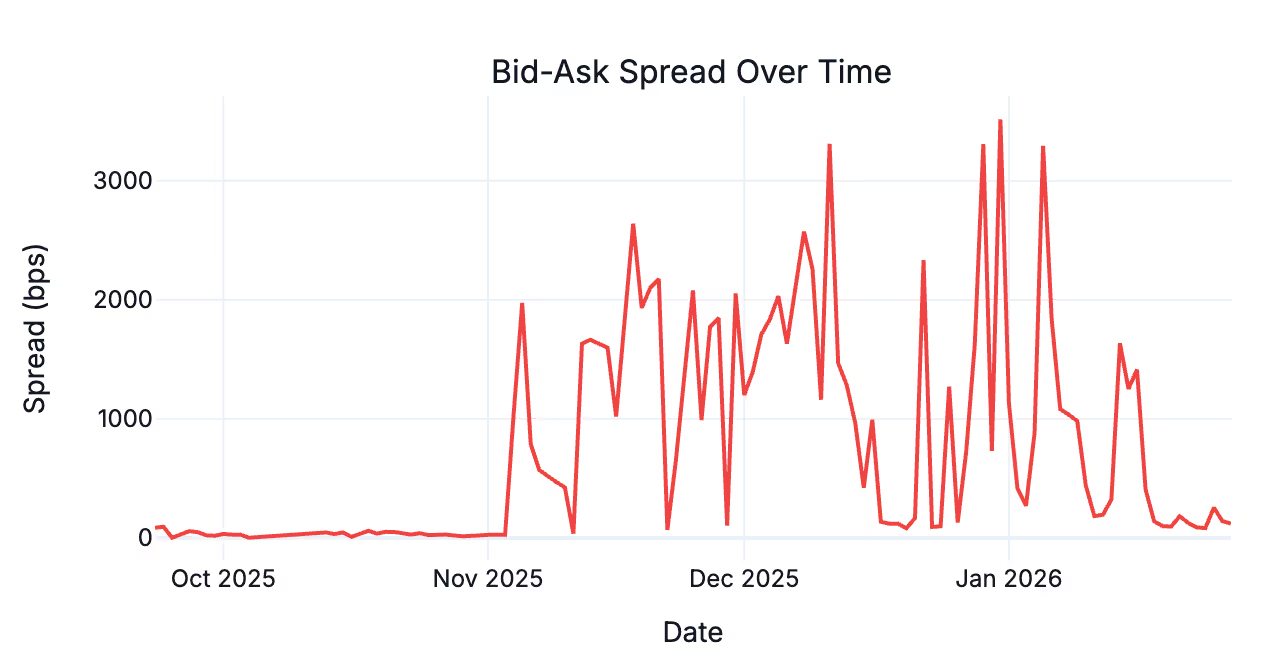
Structural weakness becomes visible when markets continue to trade but lose their ability to absorb risk. One of the earliest signals of this transition is instability in bid-ask spreads. Rather than widening smoothly, spreads begin to behave erratically, marked by sharp spikes and sudden contractions. Pricing becomes discontinuous even in the absence of sustained directional moves.
This behaviour reflects liquidity providers operating under binding inventory and risk constraints. Market makers are not price-support mechanisms; they are risk-constrained intermediaries. As volatility rises, correlations increase, and funding uncertainty grows, inventory risk accumulates faster and risk limits are reached more frequently. Quoting behaviour adapts rationally. Sizes shrink, prices widen, and quote presence becomes intermittent rather than continuous.
Importantly, this is not abandonment. Liquidity provision does not disappear outright. It becomes episodic. Quotes appear and vanish as risk is actively managed, creating liquidity gaps within previously stable price bands. This is often the first structural failure point, preceding visible depth collapse or sustained spread widening.
The result is a market that appears open and active, yet behaves unpredictably under stress. Execution quality deteriorates not because trading halts, but because risk can no longer be intermediated smoothly.
Bid-Ask Spread Over Time
Tradability Is Not Price Discovery
A market can remain tradable while failing at price discovery. Orders continue to execute, charts continue to print, and volumes may remain elevated. Yet the underlying structure may no longer be capable of intermediating risk smoothly.
Tradability reflects the ability to transact at any price. Price discovery reflects the ability to transact at predictable and bounded cost. The distinction becomes critical under stress. When liquidity is episodic, spreads unstable, and depth discontinuous, markets remain open but lose structural reliability.
Bear markets do not close markets. They reveal when tradability persists but price discovery has degraded.
Why More Market Makers Do Not Fix the Problem
A common response to liquidity stress is to add more market makers or expand venue coverage. This addresses the symptom, not the cause. In benign regimes, liquidity providers appear diversified across venues. Under stress, however, liquidity conditions tend to deteriorate simultaneously.
Diagnostics frequently show order book liquidity contracting across multiple exchanges at the same time rather than independently. This synchronisation reflects shared risk constraints, common volatility signals, and similar inventory management rules. When liquidity providers de-risk together, redundancy becomes correlated failure rather than resilience.
Order Book Liquidity Over Time (by exchange)
.avif)
Liquidity quality is not a function of headcount. It is a function of structure.
What Resilient Market Structure Looks Like
Resilient market structure does not eliminate drawdowns or suppress volatility. It absorbs stress without breaking. In resilient markets, liquidity becomes more expensive as risk rises, but it remains available and behaves predictably.
This is visible in how execution costs evolve under stress. For large, institutionally traded tokens, the cost required to move price by a fixed threshold adjusts gradually over time. Rather than collapsing in discontinuous spikes, execution costs remain bounded, with bid and ask liquidity adapting symmetrically as conditions change. Quote presence persists, and liquidity providers continue to intermediate risk, albeit at higher prices.
In diagnostics, this behaviour appears as graceful degradation rather than apparent stability. Liquidity thins as volatility rises, but it does so in a controlled manner. Execution quality deteriorates gradually, allowing market participants to anticipate costs and manage risk, rather than being exposed to sudden structural failure.
Cost to Move Price by ±2% Over Time (resilient token)

Market Structure Does Not Fix Itself
Market structure is often treated as an emergent property of trading activity. In practice, it is the result of explicit design choices and implicit incentive structures. Exchanges define fee models, tick sizes, and listing conditions. Token teams decide where to list, how liquidity is incentivised, and whether resilience is prioritised over optics. Liquidity providers respond rationally to these constraints. No single actor is responsible for resilience unless that responsibility is explicitly assigned.
In benign conditions, this fragmentation goes unnoticed. High volumes, tight spreads, and directional flow mask structural weaknesses and allow fragile equilibria to persist. Liquidity quality becomes a public good with private costs, and the system naturally converges toward the minimum viable structure required to keep markets trading.
Bear markets do not create this fragility. They expose it. When volatility rises and risk budgets bind, misaligned incentives surface immediately. Liquidity providers de-risk simultaneously. Venues protect themselves independently. Token teams discover that liquidity assumed to be persistent was, in fact, conditional. What appears as failure is often the natural outcome of a structure that was never engineered for stress.
Market structure does not self-correct through participation alone. Without explicit ownership, coordination, and accountability, it degrades toward fragility. Diagnostics can reveal the problem, but they do not solve it. Resilience only emerges when structure is treated as infrastructure rather than as a side effect of market activity.
The Diagnostic Questions That Matter
Token teams often track volume, spreads, and price. These are lagging indicators.
The structural questions are different:
- How much size can be executed within ±50 basis points during elevated volatility?
- How does executable depth change when volatility doubles?
- What percentage of liquidity depends on a single venue or counterparty?
- How persistent are quotes during directional flow?
If these questions cannot be answered, liquidity is not being managed. It is being assumed.
Conclusion
Bear markets do not punish weak products. They punish unexamined assumptions.
Liquidity that was never engineered disappears when it is most needed. Market structure that was never tested fails under stress. These failures are not anomalies. They are predictable outcomes.
Market structure is invisible until it breaks. By the time price reflects that reality, the damage is already done.
----------------------------------------------------------------------
Liquidity Diagnostics
A full Token Liquidity Report provides a venue-level assessment of executable depth, concentration risk, and stress behaviour across regimes.
👉 Request a Token Liquidity Assessment
𝘛𝘩𝘪𝘴 𝘮𝘦𝘴𝘴𝘢𝘨𝘦 𝘪𝘴 𝘧𝘰𝘳 𝘪𝘯𝘧𝘰𝘳𝘮𝘢𝘵𝘪𝘰𝘯𝘢𝘭 𝘱𝘶𝘳𝘱𝘰𝘴𝘦𝘴 𝘰𝘯𝘭𝘺 𝘢𝘯𝘥 𝘥𝘰𝘦𝘴 𝘯𝘰𝘵 𝘤𝘰𝘯𝘴𝘵𝘪𝘵𝘶𝘵𝘦 𝘪𝘯𝘷𝘦𝘴𝘵𝘮𝘦𝘯𝘵 𝘢𝘥𝘷𝘪𝘤𝘦. 𝘐𝘭𝘭𝘶𝘴𝘵𝘳𝘢𝘵𝘪𝘰𝘯 𝘨𝘦𝘯𝘦𝘳𝘢𝘵𝘦𝘥 𝘸𝘪𝘵𝘩 𝘊𝘩𝘢𝘵𝘎𝘗𝘛.
Published on 25.02.2026
Taym Moustapha
Others articles
Thought leadership
How programmable infrastructure reshapes digital asset treasury design and risk.

Thought leadership
A market-maker view on how transparency breaks DeFi execution and why privacy must scale liquidity.